
Most engineering teams managing Azure infrastructure have more visibility than they know what to do with. Cost management dashboards, advisor recommendations, and utilization graphs. The data is there, but cloud spend keeps climbing anyway.
The gap happens between the finding and a fix, specifically figuring out who owns a resource, confirming it’s safe to change, writing the remediation, getting it reviewed, and shipping it, while everyone's actual backlog is full.
This guide covers Azure cost optimization from the billing mechanics up through the three levers that drive real savings to the ownership and workflow problems that cause most optimization programs to stall.
Key Takeaways:
- Azure cloud cost optimization requires more than reserved instances. The biggest opportunities often come from usage and configuration changes that cost nothing to implement.
- Manual tagging fails at enterprise scale. Attribution that draws from deployment history, IaC, and team structure is more reliable than tag coverage alone.
- Dashboard-only approaches consistently underperform. Findings need to land in Jira, Slack, and GitHub, where engineers already work, to get acted on.
- The three optimization levers (rate, usage, and configuration) work together. Optimizing only one leaves significant savings on the table.
- Time-to-remediation is the metric that matters most. A finding that never ships isn't a saving.
How Azure Billing Works (and Where Engineers Lose Track)
Azure costs accumulate across four primary categories, each with its own pricing logic and its own failure mode.
1. Compute
Core metrics are SKU, region, runtime hours, and commitment type. Compute covers virtual machines and AKS node pools. A VM running on a D8s_v5 SKU in the East US costs more than the same workload on a B-series burstable VM in a paired region.
SKU selection at provisioning time is rarely revisited, even when workload shape changes. And teams routinely pay full Pay-As-You-Go rates for always-on dev and staging environments, or fault-tolerant stateless batch jobs that could instead run on Spot VMs or automated shutdown schedules.
2. Storage
Core metrics are tier, capacity, retention, and provisioned performance (IOPS and throughput). This category includes Blob, Managed Disks, and Snapshots. Costs accumulate quietly here because they require no active use to incur a charge.
A Blob container left on Hot tier for data accessed twice a month, snapshots accumulated over eighteen months with no expiry policy, and disks detached from their VMs but still generating charges are all common examples. Modern tiers like Premium SSD v2 and Ultra Disk decouple capacity from performance, which introduces a subtler failure mode: engineers often over-provision IOPS or throughput for a temporary migration or indexing job and forget to scale it back down, paying for idle performance indefinitely.
3. Data Transfer
Core metrics are egress volume, inter-region traffic, and intra-region cross-Availability Zone traffic. These charges scale silently with modern, highly available architectures.
Engineers designing for resiliency often route traffic in ways that generate significant transfer costs, and those costs are rarely visible in standard architecture reviews. The modern blind spot is cross-AZ traffic. Chatty microservices distributed across different zones within the same region will generate substantial data transfer bills unless topology-aware routing or proximity placement groups are explicitly configured.
4. Managed Services
Core metrics are provisioned capacity, tier (provisioned vs. autoscale or serverless), and DTUs or RUs. Services like Azure SQL, Cosmos DB, Azure OpenAI, and Redis are frequently provisioned for peak capacity and left there.
A Cosmos DB instance sized for a product launch in Q2 that never saw forecasted traffic is still running at Q2 capacity in Q3. This compounds when teams leave variable, unpredictable workloads on fixed manual provisioned throughput rather than migrating them to autoscale or serverless configurations, which would right-size consumption automatically.
Across all four categories, Azure's default configurations favor availability over cost. Pay-As-You-Go is the baseline for any resource provisioned without an explicit commitment. Commitment-based discounts exist, including reserved instances and savings plans, but they require utilization data and deliberate planning to use without overcommitting.
Cost Architecture Mapping
|
Azure Service Category |
Primary Cost Metric |
Common Waste Pattern |
|
Compute (VMs, AKS) |
SKU, region, runtime hours, commitment type |
Oversized SKUs, always-on dev/staging instances, missed Spot eligibility |
|
Storage (Blob, Managed Disks) |
Tier, capacity, retention, IOPS/throughput |
Hot-tier for cold data, orphaned disks, idle over-provisioned performance |
|
Data Transfer |
Egress volume, inter-region traffic, cross-AZ traffic |
Unoptimized routing, chatty cross-zone microservices |
|
Managed Services (SQL, Cosmos, Redis) |
Provisioned capacity, DTUs/RUs, tier |
Persistent peak provisioning, missed Autoscale/Serverless migration |
Where Azure Spend Goes Wrong: Common Waste Patterns

The waste categories below appear consistently across real Azure environments. They are practical and specific, not theoretical.
1. Idle and Oversized Resources
Dev and staging VMs running outside business hours are among the most common sources of controllable spend. A team with eight dev environments running D4s_v5 instances around the clock is paying for roughly 5,800 hours per month that no engineer is using.
Oversized SKUs are a related problem. VMs are typically provisioned for anticipated peak load and never revisited. When a service's traffic profile changes, or when the initial estimate was conservative, the SKU stays where it was. Rightsizing is chronically deprioritized because it requires engineering time, carries perceived risk, and has no clear owner once the original engineer has moved on.
Managed Disks detached from their VMs continue to incur storage charges. A disk doesn’t need to be attached to anything to generate a monthly bill.
Rightsizing stalls entirely without clear ownership. Even when an engineer identifies an oversized resource, uncertainty about whether it's safe to change, and whether it's theirs to change, is often enough to table it indefinitely.
2. Storage and Data Transfer Costs
Hot-tier Blob storage applied to infrequently accessed data is a configuration problem that compounds over time. Many storage containers are created on Hot tier by default and never migrated to Cool or Archive, even when the data they hold is accessed infrequently or only for compliance archiving.
Snapshot and backup accumulation grows in the background without a retention policy. Redundant snapshots and unmanaged disk backups are rarely cleaned up, and the costs they generate only surface as anomalies in monthly reviews, by which point they have been running for months.
Cross-region data transfer fees are often the most surprising line item for engineering leaders reviewing them for the first time. Traffic between paired regions, between VNets in different geographies, and between Azure services and the public internet all contribute to egress charges that were not part of the original cost estimate.
3. Underused Managed Services and Licensing
Azure SQL, Cosmos DB, and Redis instances provisioned for peak capacity represent some of the highest-value optimization opportunities in a typical Azure environment. A Cosmos DB configured with 20,000 RU/s for a launch that never hit projected write volume will run at that provisioning level indefinitely unless someone deliberately revisits it.
Two licensing opportunities are missed at consistent rates across most Azure environments:
- Azure Hybrid Benefit eligibility for Windows Server and SQL Server VMs, which must be applied explicitly at the VM level and is frequently skipped during provisioning
- Dev/Test pricing tiers for non-production workloads under eligible Visual Studio subscriptions, which most teams use in fewer environments than they are entitled to
|
Waste Category |
Typical Root Cause |
Optimization Lever |
|
Always-on dev/staging VMs |
No scheduled shutdown policy |
Usage |
|
Oversized production SKUs |
Peak provisioning never revisited |
Usage |
|
Orphaned Managed Disks |
No detection workflow in place |
Usage |
|
Hot Blob for cold data |
Default tier, no lifecycle policy |
Configuration |
|
Snapshot accumulation |
No retention policy |
Configuration |
|
Peak-provisioned managed services |
Launch sizing never adjusted |
Usage |
|
Hybrid Benefit not applied |
Skipped at provisioning |
Rate |
|
Dev/Test tier not used |
Awareness gap |
Rate |
Azure Cost Management Best Practices Across Three Levers
Most teams treat Azure cost reduction as a single motion that’s basically buy reserved instances, then declare victory. But significant savings come from usage and configuration changes that require no commitment to spend at all. Treating the three levers as a system, not as independent initiatives, is what separates teams who consistently reduce spend from those who optimize once and watch costs climb again.
1. Usage Optimization: Eliminating Waste at Runtime
Usage optimization addresses consumption directly: using fewer resources, for less time, at a lower scale. This lever requires active engineering effort but carries zero financial lock-in risk.
- Automate Environment Lifecycles: Implement scheduled start/stop policies for dev and staging VMs. Running non-production environments only during working hours (50 hours/week vs. 168 hours/week) yields an immediate ~70% reduction in compute runtime. Crucially, the lifecycle automation must force a stopped (deallocated) state via the Azure API (Portal, CLI, or Azure Automation); an internal OS-level shutdown leaves hardware reserved and compute billing active. Furthermore, remember that while compute drops to zero, associated storage (managed disks) and static public IPs continue to generate charges 24/7.
- Validate the Scale-In: Configure autoscaling for AKS node pools and VM Scale Sets (VMSS). Crucially, verify that scale-in policies are actually triggering. Autoscaling configured only for scale-out protects availability but acts as a one-way ratchet for costs if pods or instances fail to evict safely.
- Execute Idle Resource Sweeps: Run automated policy audits across all subscriptions to catch zombie infrastructure: zero-CPU VMs, detached/orphaned managed disks, unassociated public IP addresses, and empty resource groups hosting lingering hidden load balancers.
- Contextualize Tagging: Review environment tagging coverage as an input to usage optimization, with the explicit acknowledgment that tag coverage is usually trailing and incomplete. Use automated Azure policies to enforce tags at provisioning time rather than cleaning them up retroactively.
2. Configuration Optimization: Fixing Expensive Defaults
Configuration optimization addresses resources that are running exactly as provisioned but were provisioned incorrectly for the actual architecture or workload demands.
- Storage Tier Lifecycle Automation: Implement Azure Blob lifecycle management policies to move infrequently accessed data from Hot to Cool, Cold, or Archive tiers automatically based on last-modified or last-accessed timestamps.
- Modern Disk Selection & Performance Rightsizing: Premium SSD v1 is the default in many ARM and Terraform templates, which ties performance directly to capacity (forcing you to buy a massive disk just to get high IOPS). Transition workloads to Premium SSD v2 where supported, allowing you to independently provision the exact IOPS and throughput required while keeping disk capacity small. For non-production or web-serving workloads, evaluate Standard SSD or HDD tiers.
- Azure Hybrid Benefit (AHUB): Capitalize on existing on-premises Windows Server and SQL Server licenses. Failing to check the AHUB box on eligible cloud workloads results in paying double for software licensing directly through your Azure bill.
- Network Pathing Review: Reduce cross-region and cross-availability zone data transfer penalties. Ensure chatty microservices are bound by proximity placement groups or utilize topology-aware routing within AKS to avoid the silent tax of intra-region zone egress.
3. Rate Optimization: Commitments and Pricing
Rate optimization covers any change to how much you pay per unit of consumption without changing how much you consume.
- Azure Reserved Instances (RIs): Offer the deepest discounts (up to 72%) on 1-year and 3-year terms, but require a strict commitment to a specific VM family and region. They are best reserved for highly stable, predictable baselines.
- Azure Savings Plans: Provide dynamic flexibility. The Compute Savings Plan (1 or 3-year) automatically applies to spend across different VM families, regions, and container services (AKS/ACI). The Database Savings Plan (1-year) provides similar flexible coverage across managed data services like Azure SQL and PostgreSQL.
- The Strategy: Analyze 30-to-90 days of utilization history before committing to anything. Commitment scope should match your actual, historical baseline floor, not optimistic engineering projections.
The most common mistake is overcommitting on instance families that are actively being rightsized. If you commit to Dv3-series Reserved Instances right before an engineering team migrates the architecture to Ev5 VMs, you lock in wasted spend, and as of July 1, 2026, new and renewed 1-year and 3-year RIs for the Dv3/Dsv3/Ev3/Esv3 series are no longer available for purchase at all, making this exact mistake a live risk rather than a hypothetical one.
Note: While Azure allows a one-way trade-in of Compute RIs for a flexible Savings Plan, traditional RI-to-RI cross-family exchanges are restricted. When in doubt, lean on savings plans for dynamic environments.
Commitment Summary
|
Commitment Type |
Eligible Services |
Flexibility |
Max Discount vs. PAYG |
|
Reserved Instances (1-Year) |
VMs, Dedicated Host, SQL, Cosmos DB |
Low (scoped to instance family & region) |
Up to 40-45% |
|
Reserved Instances (3-Year) |
VMs, Dedicated Host, SQL, Cosmos DB |
Low (scoped to instance family & region) |
Up to 65-72% |
|
Compute Savings Plan (1 or 3-Year) |
VMs, AKS (underlying compute), ACI, App Service, Functions |
High (Applies automatically across families/regions) |
Up to 65% (on 3-year) |
|
Database Savings Plan (1-Year) |
Azure SQL, DB for PostgreSQL/MySQL, SQL Server on Azure VMs |
High (Applies automatically across tiers/regions) |
Up to 35% |
The Ownership Problem in Azure Environments
The three levers above produce a backlog of optimization work. But the technical fixes rarely happen at scale without resolving one underlying problem first, which is that no one is responsible for ownership.
Why Manual Tagging Fails at Scale
Tagging is the standard attribution mechanism in Azure Cost Management. In theory, a consistent tag schema applied to every resource maps each cost line to a team, product, or cost center. In practice, tag coverage degrades consistently at enterprise scale.
Resources deployed through automation often skip tags. New hires apply different schemas than the agreed-on one. Tag hygiene becomes a maintenance burden with no clear owner. And when a tag exists, it may point to a team that no longer owns the resource.
The result: costs are visible in aggregate but unattributable at the resource level. When no engineer is clearly responsible for a specific finding, the optimization backlog grows.
Connecting Resources to the Engineers Who Can Fix Them
Attribution that works at scale draws from signals beyond tags. Deployment history, Git commit activity, IaC ownership, and team structure in Microsoft Entra ID all carry signals about who provisioned a resource and who has context about it.
When ownership is inferred from these signals, findings can route directly to the engineer or team most likely to have the context and authority to act. This is the prerequisite for workflow-integrated optimization. You cannot deliver a specific fix to the right person if you don't know who the right person is.
Azure Optimization: Workflow Integration Is Where Most Programs Stall
Most teams have enough visibility to identify optimization opportunities. The reason those opportunities stay on the list isn't lack of knowledge but the distance between a finding and an engineering action.
Why Dashboard-Only Approaches Don't Drive Action
Engineers work in Jira, GitHub, and Slack, not on cost dashboards. When an optimization recommendation requires an engineer to log into a separate tool, manually triage the finding, determine whether it belongs to them, and then return to their normal workflow to implement it, the friction is high enough that most recommendations are never acted on.
The result is a familiar pattern: optimization is reactive, addressed after a budget alert fires or during a quarterly review.
The bottleneck has never been visibility; it’s been execution.
Embedding Cost Decisions Into Engineering Workflows
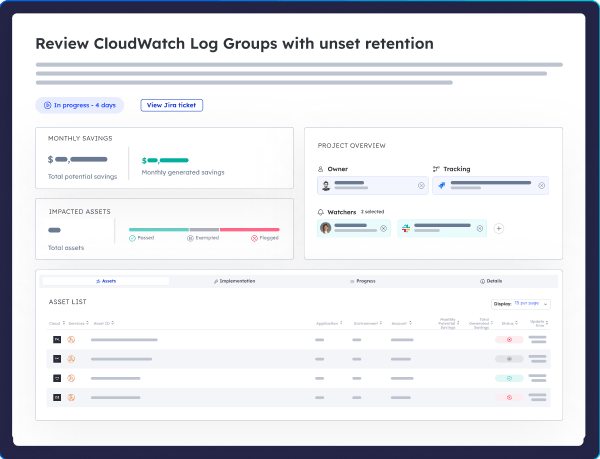
The most effective Azure cost optimization approach delivers specific, actionable findings directly into the tools engineers already use. A finding that arrives as a Jira ticket with a clear description, impact estimate, and remediation steps looks exactly like any other engineering task. A GitHub PR ready for review requires no context switch at all.
The workflow integration pattern that works:
- A Jira ticket with a clear description, impact estimate, and remediation steps routed to the owning team
- A GitHub PR with the IaC change ready for review
- A Slack message to the relevant team with full context already assembled
Engineering leaders benefit because ownership is tracked, progress is visible, and they can report on it without chasing teams for status updates.
Azure FinOps: Measuring Progress and Building Durable Habits

Azure cost optimization isn't a one-time project. Costs change as workloads evolve, teams grow, and new services are adopted. The teams who sustain low cloud waste rates are the ones who treat optimization as an ongoing engineering discipline, not a periodic initiative.
KPIs That Signal Real Progress
Total spend is a poor signal in isolation. It increases with business growth and decreases with usage changes unrelated to optimization work. The KPIs that reflect actual progress are more specific:
|
KPI |
What It Measures |
Target Direction |
|
Cost per deployed unit (per service, per team, per environment) |
Efficiency of resource consumption relative to output |
Decreasing over time |
|
Idle resource percentage |
Backlog of unaddressed waste opportunities |
Decreasing quarter-over-quarter |
|
Commitment utilization rate |
Percentage of Reserved Instances and Savings Plans being used |
Increasing toward 85%+ |
|
Time-to-remediation |
Duration between a finding being surfaced and a fix being shipped |
Decreasing |
Time-to-remediation is the most important of these. A finding that surfaces in a dashboard and sits there for six weeks does not represent a saving. It represents a visibility tool that did not close the loop.
Building Optimization Habits Into Engineering Work
Optimization habits that stick are embedded in workflows engineers already follow, not added as a separate process:
- Cost estimates attached to new resource configurations at deployment time, before resources ship, rather than discovered weeks later in a billing review
- Regular rightsizing reviews built into platform team sprints, not scheduled as separate meetings competing with engineering priorities
- Anomaly alerts are routed to the owning team automatically, rather than to a central function that manually re-routes them with added delay
- Optimization backlog tracked the same way technical debt is tracked: prioritized, assigned, and closed
Choosing an Azure Cost Optimization Tool
Azure Cost Management provides solid native visibility. Where it falls short is cross-resource ownership attribution, workflow-native delivery, and automated remediation. The gap between identifying a finding and shipping a fix does not close without tooling that addresses execution, not just reporting.
What to Look for Beyond Native Cost Management
Third-party Azure optimization solutions differ significantly in how they close the execution gap. The evaluation criteria that matter for engineering-led teams:
- Attribution method: Does the tool require complete tagging to assign ownership, or can it infer ownership from deployment history, IaC, and team structure?
- Workflow integration: Does it deliver findings into Jira, Slack, and GitHub, or does it require engineers to work in a separate dashboard?
- Optimization coverage: Does it address all three levers (rate, usage, and configuration), or is it narrowly focused on one?
- Remediation approach: Does it generate actionable fixes with full context, or does it surface a list and stop?
- Human oversight: Are engineers always in the approval loop before anything changes in the environment?
A tool that scores well on coverage but requires engineers to work in a separate interface to act on findings will produce the same outcome as no tool at all: findings accumulate in a queue nobody checks. The right Azure cost optimization tool makes the path from finding to fix as short as possible.
Where CxM Fits in an Azure Optimization Stack
Dex, CxM's AI teammate, connects to your Azure environment alongside Git and communication tools. It runs the Map > Find > Fix workflow: building a living map of your infrastructure, identifying cost and configuration issues, and investigating each one through to a ready-made remediation plan.
For each finding, Dex assembles the full context (root cause, affected resource, impact estimate, and the team responsible) and determines it not from tags alone, but from deployment history, IaC ownership, and team structure. It delivers the fix as a PR, script, or Jira ticket routed to the engineer who owns it.
Engineers stay in control. Nothing ships without human approval. By the time a finding reaches an engineer, the investigation is already done. They are reviewing a complete remediation plan and deciding whether to approve it, not opening a dashboard and starting from scratch.
The result is that the gap between a finding being identified and a fix being shipped closes from weeks to days.

From Azure Cost Visibility to Engineering Action
Azure cloud optimization stalls not because of missing visibility, but because of missing ownership and missing workflow integration. The bill is visible. The path from bill to fix isn't.
The path forward:
- Understand where spending accumulates across compute, storage, data transfer, and managed services
- Apply optimization across all three levers (rate, usage, and configuration) rather than defaulting to reserved instances alone
- Resolve the attribution problem at the source, using signals beyond manual tags to connect resources to the engineers who can act
- Embed remediation into engineering workflows so cost work competes for attention the same way any other ticket does
When findings route to the right engineer automatically, and when remediation looks like any other item in the sprint backlog, the cost of staying optimized drops significantly. Azure cost management becomes a habit, not an initiative.
Ready to see what Dex finds in your Azure environment within hours of connecting? Book a demo today.