
Cloud environments are constantly evolving these days due to new technologies that enable increased optimization. But as infrastructure scales across regions, providers, and workloads, it becomes increasingly difficult to track what’s running, what’s failing, and what’s costing more than it should.
Effective cloud monitoring means embedding observability into workflows, linking performance to ownership, and driving action through automation. In this guide, we’ll walk through how cloud monitoring works, which tools and strategies to use, and how to build a system that keeps your engineering team fast, efficient, and informed.
What Is Cloud Monitoring?
Cloud monitoring is the continuous observation, analysis, and tracking of cloud-based systems, services, and infrastructure to ensure optimal performance, uptime, and security. It empowers technical teams to detect anomalies early, pinpoint bottlenecks, and maintain reliability across dynamic environments.
The Purpose of Cloud Monitoring
In modern cloud-native environments, monitoring is a fundamental capability. The primary objectives of cloud monitoring include:
- Early Issue Detection: Rapidly identifying misconfigurations, degraded services, or potential failures before they impact end users.
- Ensuring Availability: Monitoring uptime and responsiveness of critical services to meet SLAs and user expectations.
- Optimizing Workloads: Analyzing resource usage patterns to identify inefficiencies, prevent overprovisioning, and fine-tune performance.
When implemented effectively, cloud monitoring serves as the first line of defense, identifying signals that inform reliability engineering, scaling decisions, and incident response.
The Scope of Cloud Monitoring
Cloud monitoring extends far beyond simple uptime checks. Effective monitoring strategies span across layers:
|
Layer |
What’s Monitored |
|
Compute |
VM instances, containers, autoscaling groups, CPU/memory load |
|
Storage |
Disk usage, IOPS, throughput, S3 latency/errors |
|
Networking |
Bandwidth, packet loss, and connection latencies |
|
Applications |
API response times, service health, error rates |
|
Data Flows |
ETL pipelines, event-driven workloads, and streaming consistency |
Each layer produces different signals. Cloud monitoring helps teams correlate them to understand the full operational picture.
Monitoring vs. Observability: What’s the Difference?
While the terms are often used interchangeably, monitoring and observability are distinct, yet complementary.
|
Monitoring |
Observability |
|
Answers "Is it working?" |
Answers "Why isn’t it working?" |
|
Focuses on known failure states |
Helps explore unknown or emergent failure modes |
|
Relies on predefined metrics and alerts |
Built on logs, metrics, traces, and event context (telemetry) |
|
Tools: CloudWatch, Prometheus, Datadog |
OpenTelemetry (instrumentation standard), Honeycomb (observability platform), and other tracing-first vendors. |
Monitoring gives you visibility into system health. Observability gives you the context to understand behaviors and troubleshoot complex issues.
How Does Cloud Monitoring Work?
Cloud monitoring operates by continuously collecting, aggregating, and analyzing data across cloud infrastructure, applications, and services to detect anomalies, understand performance trends, and trigger alerts when thresholds are breached. It provides engineers with real-time visibility and context, enabling them to take proactive action rather than resorting to reactive firefighting.
Data Collection: Agents, APIs, and Logs
Cloud monitoring begins with data collection. This is typically done through:
- Monitoring Agents installed on virtual machines or containers to gather OS- and application-level metrics.
- Cloud-native APIs (like AWS CloudWatch or Azure Monitor) to collect service-level telemetry without deploying custom agents.
- Log Ingestion Pipelines that capture structured and unstructured logs from services, applications, and infrastructure layers for pattern detection and root-cause analysis.
This data serves as the raw material for cloud monitoring tools to derive insights and trigger alerts.
Real-Time Metrics Aggregation
Once collected, metrics are aggregated in real time. Commonly tracked metrics include:
- Latency: The time it takes for a request or operation to complete.
- Throughput: Volume of operations handled in a given time frame.
- Resource Utilization: CPU, memory, disk I/O, and GPU saturation across workloads.
- Error Rates: Frequency of failures or exceptions, broken down by service or endpoint.
These metrics help teams build dashboards, establish baselines, and quickly identify when something deviates from expected behavior.
Key Metrics to Monitor in the Cloud
|
Category |
Key Metrics |
|
Performance Metrics |
CPU usage, memory consumption, disk IOPS, application latency |
|
Network Metrics |
Bandwidth utilization, packet loss, and connection throughput |
|
Application Metrics |
Error rates, request latency, service uptime, 5xx/4xx breakdowns |
|
Security Metrics |
Unusual login patterns, failed auth attempts, port scanning, data exfiltration |
|
Cost Metrics |
Usage spikes, idle resource detection, inefficient autoscaling, waste indicators |
Cost metrics aren’t just for finance, either. Integrating them into monitoring also enables engineers to see how performance and reliability trade-offs impact spending in real-time.
Alerting and Anomaly Detection Workflows
Modern cloud monitoring goes far beyond passive visibility. It supports automated workflows that detect, correlate, and surface anomalies before they become incidents.
Alerts are typically triggered when thresholds are crossed (e.g., CPU > 90% for 5 minutes). Still, more advanced systems employ anomaly detection, identifying patterns that deviate from normal baselines, even if no static threshold is breached.
These systems often correlate multiple signals:
- A spike in error rates following a code deployment
- Increased latency in a specific region or availability zone
- Reduced throughput following an infrastructure autoscaling event
By correlating metrics with events like deployments, configuration changes, or infrastructure failures, monitoring tools enable faster diagnosis and remediation.
In modern operations, these alerts are increasingly routed first to AI agents that query runbooks, assess blast radius, and attempt automated remediation before escalating to a human. Designing for this model means writing machine-readable runbooks, structuring telemetry so an agent can reason over it, and defining explicit escalation criteria. Alerting someone becomes the exception, not the default tier.
Types of Cloud Monitoring
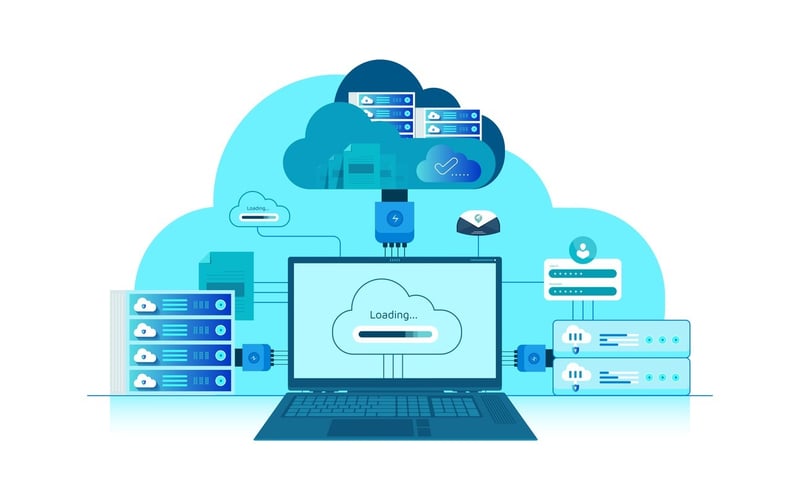
Cloud monitoring spans multiple domains of the cloud ecosystem, each with distinct focus areas and tools. Below is an overview of the key types of cloud monitoring and what they enable:
1. Cloud Infrastructure Monitoring
Cloud Infrastructure Monitoring focuses on the foundational elements of cloud environments, including virtual machines, containers, and storage systems. It helps teams monitor instance-level metrics, such as CPU, memory, and IOPS, to prevent bottlenecks and outages.
Example: Tracking the performance of EBS volumes, EC2 instances, or Kubernetes clusters to ensure infrastructure scales reliably under load.
2. Cloud Application Monitoring
Application Performance Monitoring (APM) zeroes in on service-level metrics and the end-user experience. It captures metrics like request latency, transaction traces, and error rates to detect regressions or failures in production.
3. Cloud Network Monitoring
Cloud Network Monitoring tracks the flow of data between cloud services, regions, and hybrid environments. It provides visibility into latency, packet loss, and network throughput, which are critical for distributed systems and API-driven architectures.
4. Cloud Database Monitoring
Monitoring at the database layer helps ensure query efficiency, replication integrity, and connection stability. It enables early detection of slow queries, failed transactions, or memory pressure that can degrade application performance.
5. Cloud Health Monitoring
This provides a bird’s-eye view of overall service health and system reliability. It aggregates metrics, logs, and traces into centralized dashboards that simplify troubleshooting and accelerate root-cause analysis.
6. Cloud Workload Monitoring
Focused on compute-heavy tasks, this type of monitoring tracks usage, performance, and failure points in resource-intensive jobs. It’s especially important for teams running AI/ML training, HPC simulations, or large-scale data processing.
Example: Observing Amazon SageMaker training job runtimes, GPU utilization, or batch processing in GKE clusters.
Monitoring Cloud Environments and Models
Cloud monitoring strategies must adapt to the architecture they serve. Whether you're operating fully in the public cloud, managing on-prem infrastructure, or navigating hybrid or multicloud deployments, the principles of observability stay constant, but the implementations differ.
Below is a breakdown of how monitoring works across the four major cloud models.
1. Public Cloud Monitoring
In public cloud environments, monitoring is primarily powered by native telemetry pipelines provided by platforms like AWS, Azure, and GCP. These services expose metrics, logs, and events through APIs, allowing teams to track system health at scale.
However, the real power of public cloud monitoring lies in how that telemetry is utilized. Ownership inference associates usage data with teams or services, eliminating blind spots in cost or performance attribution. Real-time anomaly detection plays a crucial role here, alerting engineers to spikes in latency, storage saturation, or unexpected network egress before users are affected. Integrating monitoring definitions directly into infrastructure-as-code (IaC) pipelines ensures observability is automatic. Every time a developer deploys a new instance or service, monitoring is provisioned alongside it, reducing the risk of missed coverage.
2. Private Cloud Monitoring
Monitoring private cloud infrastructure involves a closer relationship with the underlying hardware and virtualization layers. Instead of relying on native cloud APIs, teams must implement health checks across hypervisors, virtual networks, and storage arrays to detect potential degradation early.
Capacity forecasting and performance trend analysis help identify when additional compute or storage should be provisioned, keeping systems ahead of demand curves.
Security posture monitoring is another critical component. By analyzing access logs and configuration states, teams can identify signs of unauthorized behavior or internal misconfigurations. In more mature private data center environments, monitoring may even extend to physical infrastructure, tracking power usage, cooling efficiency, or hardware wear to prevent silent failures that impact application uptime.
3. Hybrid Cloud Monitoring
Hybrid environments introduce the complexity of managing both on-prem and public cloud systems, which means monitoring solutions must bridge disparate platforms without losing context. Unified visibility is essential. Telemetry data from both domains must be collected, normalized, and presented in a single view to avoid a fragmented understanding of the data.
Hybrid monitoring also requires tracing network connectivity between environments, including VPN tunnels, Direct Connect links, or interconnect gateways that can become performance bottlenecks. Latency and dependency mapping help teams visualize how slowdowns or outages in one environment affect services in the other, enabling faster resolution. Policy alignment adds another layer of complexity, ensuring that consistent security and compliance standards are upheld across both cloud and on-premises infrastructure—a non-negotiable requirement in regulated or enterprise environments.
4. Multicloud Monitoring
Monitoring in multicloud architectures presents the challenge of reconciling the metrics and definitions of system health across multiple providers. Each cloud platform exposes unique telemetry — AWS reports CPU credits for burstable instances, Azure Cosmos DB measures throughput in Request Units (RU/s), and GCP surfaces its own native metrics through Cloud Monitoring — so cross-provider metric normalization is required to compare performance meaningfully. Teams must also enforce consistent incident thresholds across providers to avoid noisy alerts or missed anomalies caused by misaligned baselines.
Centralized logging and tracing, ideally via open formats such as OpenTelemetry, enable event correlation and incident investigation regardless of where services are running. Lastly, multicloud monitoring must incorporate cost-performance analysis. Without proper oversight, redundant architectures can silently accumulate waste, negating the intended benefits of provider diversity. Monitoring in this context ensures that resilience remains efficient and intentional.
Monitoring as a Service in Cloud Computing
Monitoring as a Service (MaaS) refers to fully managed monitoring solutions which may be provided by cloud service providers (CSPs), such as AWS, Azure, and Google Cloud, or a third-party SaaS vendor. These services (such as Amazon CloudWatch, Azure Monitor, and Google Cloud Operations Suite) are tightly integrated into their respective platforms, offering built-in telemetry pipelines, API access, and seamless integration with native billing, identity, and resource management systems.
Advantages of Monitoring as a Service
Using a managed service offers several operational and strategic benefits:
- Lower operational overhead: No need to manage monitoring infrastructure, install agents, or maintain custom pipelines.
- Built-in compliance and SLAs: Many services include security, regional availability, and uptime guarantees as part of the platform offering.
- Elastic scalability: Monitoring capacity automatically scales with your infrastructure, adjusting to traffic spikes or rapid deployments without additional setup.
- Seamless cloud integration: Native alignment with cloud resources, policies, and billing data enhances telemetry accuracy and facilitates effective ownership mapping.
Trade-offs of Using MaaS
However, relying solely on CSP-provided monitoring services introduces a few limitations:
- Vendor lock-in: Deep integration makes it difficult to migrate or build a multi-cloud observability strategy.
- Limited customization: Advanced use cases may require capabilities that native tools don’t offer, such as custom retention periods, enriched telemetry, or fine-grained alert logic.
- Proprietary telemetry formats: Logs and metrics may not easily translate across platforms or into open standards, reducing interoperability.
- Data control limitations: Users often have less control over how long data is retained, where it’s stored, or how it's enriched before analysis.
For teams focused on speed, scalability, and platform consistency, MaaS offers an efficient entry point. But if long-term flexibility or cross-cloud visibility is a priority, consider layering in open-source or vendor-neutral observability tooling.
Cloud Monitoring Tools
With the increasing complexity of cloud-native architectures, choosing the right monitoring tool means embedding observability into your development workflow, aligning telemetry with cost and ownership, and enabling automation wherever possible. Whether you're selecting a native CSP tool, open-source platform, or third-party solution, your choice should align with how your team builds, ships, and operates cloud infrastructure.
Leading Cloud Monitoring Tools
|
Tool |
Primary Use |
Ideal For |
Unique Strength |
|
AWS CloudWatch |
Native cloud monitoring |
AWS workloads |
Deep integration with AWS ecosystem |
|
Azure Monitor |
Native monitoring for Azure |
Microsoft cloud users |
Unified app + infra visibility |
|
Google Cloud Operations Suite |
GCP workloads |
Data-intensive apps |
End-to-end tracing and APM |
|
Datadog |
Multi-cloud & container |
Enterprise DevOps |
AI anomaly detection & automation |
|
Grafana Cloud |
Open-source-based |
Developers, SREs |
Extensible dashboards, Prometheus integration |
|
Dynatrace |
Full-stack monitoring |
Enterprises |
AI-driven insights (Davis AI) |
|
New Relic |
Application & infra |
Engineering teams |
Unified telemetry across services |
|
Cloud ex Machina |
Pre and post-deployment cost governance & remediation |
Engineering orgs |
Flags cost and compliance issues before deployment and proposes remediation plans for waste in running infrastructure as Jira tickets or Terraform PRs. |
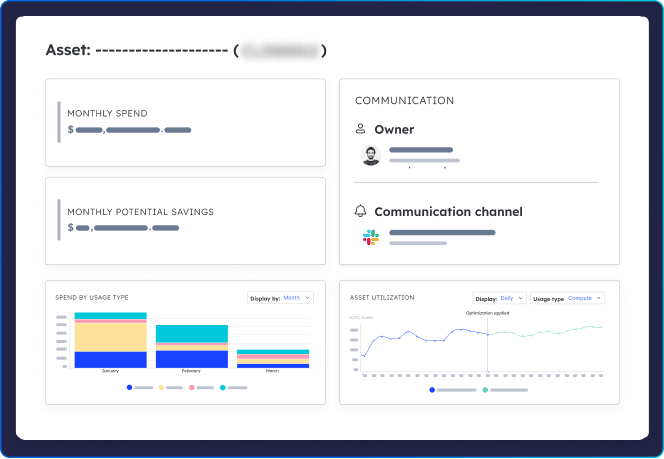
Most tools in this list answer the same question: “What is my infrastructure doing right now?” That's necessary but incomplete. As AI coding assistants accelerate infrastructure creation, teams also need governance at the point of generation: ensuring new resources are cost-aware, compliant, and consistent with existing patterns before they're deployed. That's the layer Cloud ex Machina (CxM) adds — complementing tools like Datadog or Dynatrace rather than replacing them.

Choosing the Right Cloud Monitoring Tool
When evaluating monitoring tools, prioritize based on how well they integrate with your existing development and deployment workflows, and whether they support intelligent automation—not just passive alerts. Key criteria include:
- Integration: The best tools work where developers already live: in CI/CD pipelines, Slack channels, Terraform plans, and Git repos. Seamless integration reduces friction and drives adoption.
- Scalability: Your monitoring solution should be able to handle telemetry from thousands of services and regions without performance degradation or requiring manual tuning.
- Contextualization: Look for platforms that link performance data to ownership or cost. For example, Cloud ex Machina (CxM) connects metrics to engineering projects, teams, and business KPIs — turning insights into accountable, actionable work.
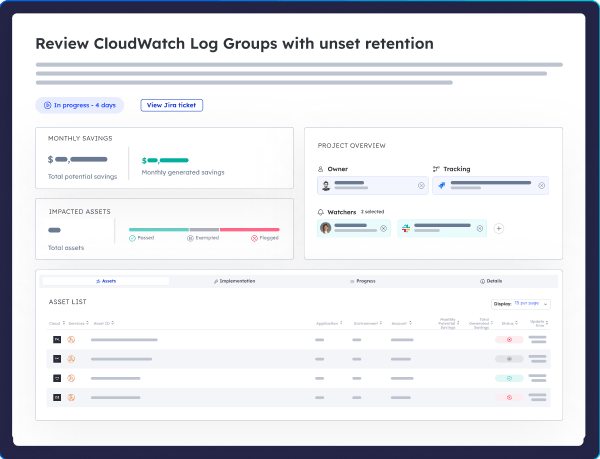
- Automation: Reactive alerts aren’t enough. Choose tools that can automatically remediate common issues (e.g., restarting failed services, resizing infrastructure) or route fixes into developer workflows via pull requests or Jira tickets.
- Customization: Extensible dashboards, open APIs, and programmable alerts enable you to tailor observability to your environment and adapt it as your architecture evolves.
Building an Effective Cloud Monitoring Strategy
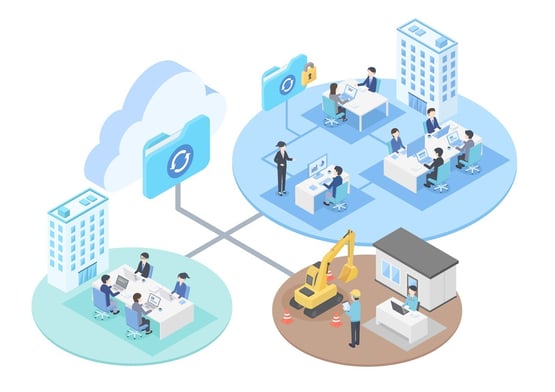
Developing a reliable, scalable, and cost-aware cloud monitoring strategy requires more than choosing the right toolset. It requires a layered approach that aligns metrics with business outcomes, integrates seamlessly into developer workflows, and enables teams to act on insights rather than merely observe them. Below are the core components of a modern cloud monitoring strategy.
1. Define Clear Monitoring Objectives
Start by identifying what you need to monitor and why. Align each metric with a tangible business or operational goal:
- Uptime metrics: to meet SLA and SLO targets
- Latency metrics: to protect user experience and response times
- Cost metrics: to tie engineering performance to FinOps and usage efficiency
Without this alignment, your monitoring will generate noise instead of insight.
2. Design Your Monitoring Architecture
Choose between a centralized or distributed monitoring architecture based on your team structure, data volume, and compliance needs:
- Centralized monitoring works best for smaller or single-team organizations that want unified visibility.
- Distributed monitoring is useful in multi-tenant environments or global teams needing separation and custom controls.
Regardless of your structure, implement telemetry pipelines using tools like OpenTelemetry, Fluentd, or Loki to ingest and standardize logs, traces, and metrics. Incorporate RBAC (role-based access control) and tenant isolation for governance at scale.
3. Embed Monitoring into Developer Workflows
Don't rely on dashboards no one checks. Instead, make monitoring actionable by embedding alerts into the systems that act on them — whether that's a human or an AI agent.
In AI-native operations, alerts are increasingly routed to autonomous agents as tier-0 responders. These agents query runbooks, assess scope, and attempt remediation before a human is ever paged. When they succeed, the human workflow is a closed Jira ticket, not a 2am alert. When they don't, the escalation to Slack, PagerDuty, or GitHub carries full context: what the agent tried, what it found, and why it escalated. This means your monitoring setup needs to serve two audiences:
- Agents: structured alerts with machine-readable runbooks, clear remediation boundaries, and explicit escalation criteria.
- Humans: contextual notifications in Slack, Jira, or GitHub with ownership, affected services, and suggested next steps attached.
This approach eliminates context-switching, accelerates resolution, and builds monitoring habits that scale beyond what any on-call rotation can absorb.
4. Set Actionable Alerting and Incident Workflows
Avoid alert fatigue by focusing on signal over noise. Define thresholds that trigger alerts only when action is required.
- Integrate with tools like PagerDuty or ServiceNow to escalate based on severity (and if you still use Opsgenie, plan migrations—Opsgenie is scheduled to shut down on April 5, 2027). Where supported, route alerts to AI agents as tier-0 responders. These agents can attempt remediation autonomously and escalate to humans only when they exceed their confidence threshold or authorization scope.
- Ensure alerts are contextual—link them to the impacted service, user flow, or deployment stage.
Well-tuned alerting shortens your MTTR (mean time to resolution) and builds team confidence in incident response.
5. Automate Wherever Possible
Automation is the difference between reactive and resilient systems. Implement:
- Auto-remediation scripts for common issues like service restarts, node reboots, or capacity scaling.
- Predictive analytics to detect anomalies and preempt SLA breaches.
- ML-based adaptive thresholds that evolve as your baseline behavior shifts.
These practices keep teams focused on value delivery rather than firefighting.
6. Layer in Security and Compliance Monitoring
Monitoring should extend to security and regulatory compliance. Build continuous monitoring into your infrastructure by:
- Enforcing standards like SOC 2, ISO 27001, and GDPR through live configuration and access tracking.
- Using CSP-native tools like AWS GuardDuty and Microsoft Defender for Cloud for threat detection.
- Integrating with SIEM platforms (e.g., Splunk, Elastic) for cross-domain correlation between performance and security events.
Security monitoring is not separate from observability—it’s a vital layer of system awareness.
Cloud Monitoring Best Practices
To make cloud monitoring truly effective, teams must go beyond metrics collection and adopt best practices that drive real operational value. Here are six foundational principles to follow:
1. Instrument Everything
Ensure that all critical systems—including compute, storage, networking, APIs, and third-party services—are properly instrumented. Use standardized telemetry formats like OpenTelemetry or native integrations such as CloudWatch Metrics to create a consistent and scalable observability layer across your environment.
2. Prioritize Actionable Metrics
Don’t measure everything—measure what matters. Focus on metrics that are tied to meaningful outcomes, such as latency (user experience), uptime (reliability), and cost (efficiency). Avoid dashboards full of vanity metrics that look impressive but don’t trigger decisions or responses.
3. Automate Where Possible
Automation reduces manual overhead and improves the speed and consistency of response. Examples include auto-scaling resources, auto-ticket creation for anomalies, or self-healing scripts that restart failed services or roll back unhealthy deployments. The goal is to shift from reactive monitoring to proactive resilience.
4. Embed Monitoring in Workflows
Observability should be workflow-native, not a siloed function. Engineers should receive alerts in the tools they already use—Slack, Jira, GitHub, or CI/CD pipelines—to reduce context-switching and increase accountability.
5. Review and Refine Regularly
Monitoring isn’t “set it and forget it.” Teams should create a feedback loop by regularly reviewing thresholds, adapting alert logic, and updating tracked metrics based on changing systems and priorities. Post-incident reviews should always correlate monitoring signals to uncover blind spots and drive improvements.
6. Measure the ROI of Monitoring
The impact of good monitoring should be tangible. Track metrics like reduced downtime, faster mean time to resolution (MTTR), improved user satisfaction, and cost savings from eliminated waste or optimized usage. This helps justify continued investment and highlights engineering's contribution to business outcomes.
Conclusion
Modern cloud monitoring is no longer just about observing what's running. It's about acting on what you find, faster than any on-call rotation can. When done right, alerts route to AI agents before they notify humans, incidents resolve before users notice.
Tools like Datadog and Dynatrace give you visibility into your running infrastructure. Cloud ex Machina (CxM) covers the full lifecycle — flagging cost and compliance issues before resources are deployed and proposing remediation plans for waste in what's already running, delivered as Jira tickets or Terraform PRs your team (or its coding agents) can act on.
Ready to turn your observability into action? Explore Cloud ex Machina today.